
How to Measure Account-Based Marketing (2026): ABM KPI Framework
80% of B2B organizations say they run ABM. Only 29% measure it correctly. Here's a clear framework, four categories, three tiers, real formulas, that closes the gap.
The buying group moved.
Measurement didn't.
~22 stakeholders now shape a typical B2B decision.
94% of buying groups pick a preferred vendor before first contact. Yet nearly half of ABM teams still measure success through MQLs from random accounts.
of ABM teams measure with ABM-aligned metrics. The rest report MQLs.
of buying groups pick a winner before first sales contact. 77% buy from that pick.
of practitioners say proving ABM ROI is their #1 challenge.
Measurement built around the lead, a single person, a single form. But you can't see a 22-person buying group, let alone tell you whether you're inside the window.
Four KPI categories. One sequence.
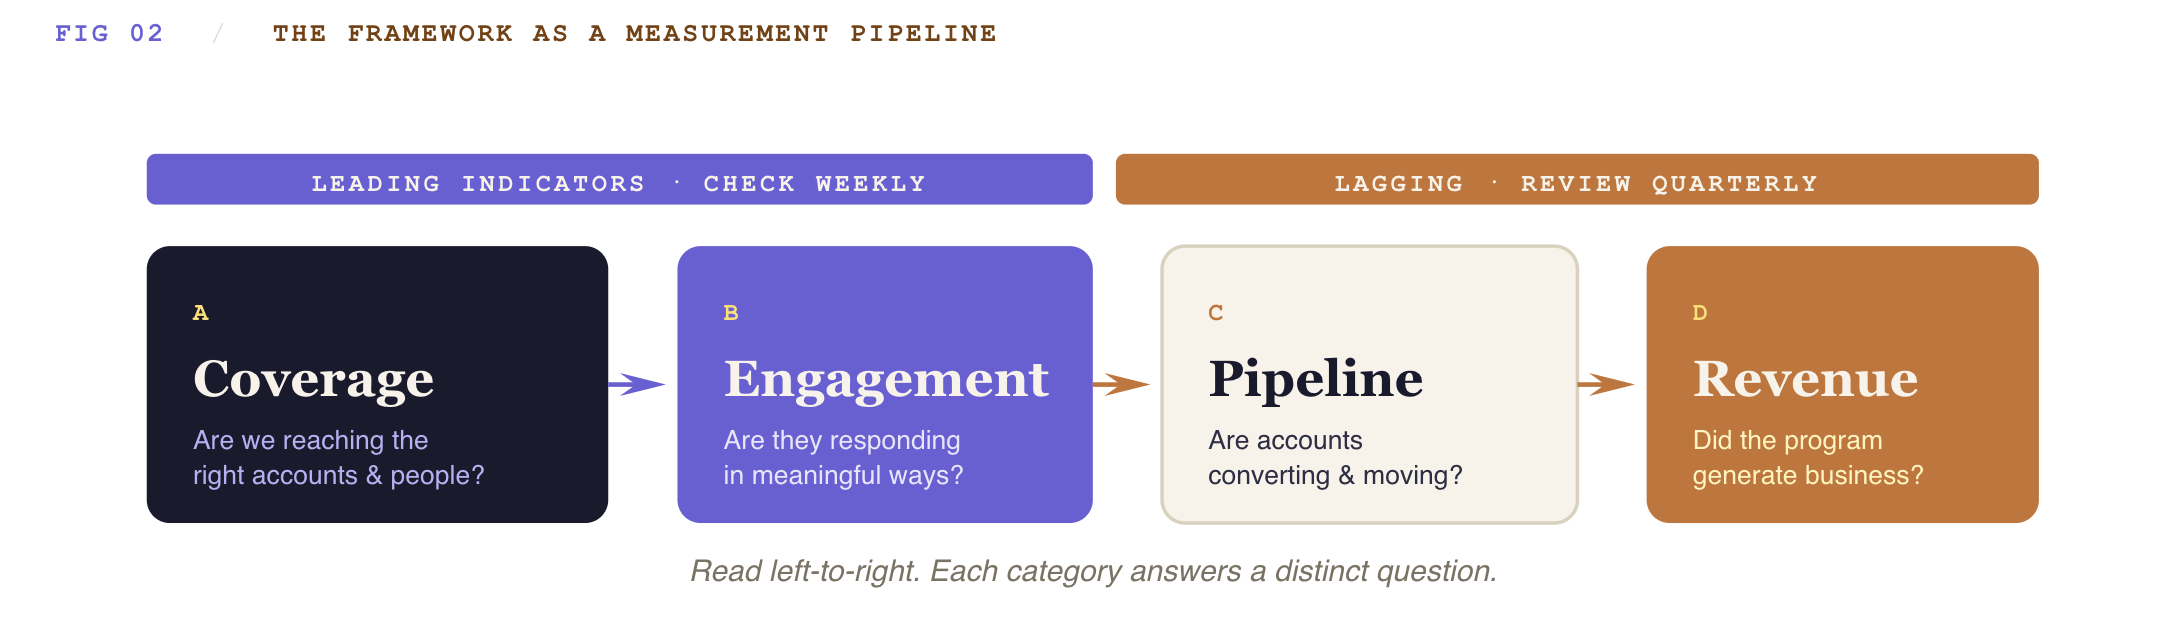
Every ABM KPI belongs to one of four categories: Coverage → Engagement → Pipeline → Revenue.
The first two are leading indicators you watch weekly. The last two are lagging indicators you review quarterly. The framework reads left-to-right as a pipeline. Skipping a category breaks the chain.
Tracking infrastructure depends entirely on your data layer. Whether you are orchestrating workflows using HubSpot ABM toolsets or scaling intent signals with Demandbase, consistency in account scoring is vital (see our deep dive on HubSpot ABX vs Demandbase).
Coverage & account health
"Are we reaching the right accounts and the right people inside them?"
Target Account Coverage
Buying Committee Coverage
Multi-Threading Depth
(≥4 mid-mkt, ≥6 enterprise)
Why it matters → Forrester (2026) frames the buying network as 13 internal + 9 external influencers. If you can't see who you're reaching, the rest is guesswork.
Engagement quality
"Are accounts responding in ways that signal real intent — not just casual exposure?"
Account Engagement Score
ad=1, content=5, demo=10
Hot Account Count
Touchpoint Volume
(mature: 50+)
Why it matters → Raw activity (clicks, opens) describes the campaign. Weighted engagement describes the account.
Pipeline & velocity
"Are target accounts converting to opportunities — and moving faster than non-ABM accounts?"
Account-to-Opp Rate
Pipeline Velocity Lift
ABM-Sourced Pipeline $
Why it matters → First category where ABM proves distinguishable from broad demand-gen. Ad-influenced accounts move 234% faster at elite programs.
Revenue & ROI
"Did the program generate measurably better business outcomes than non-ABM motion?"
Win Rate Lift
ACV Lift
Program ROI
Why it matters → Treat as board-level proof, not monthly scorecard. ABM-sourced deals close 33% larger; average ROI is 137%.
Same framework. Different weights by tier.
All three ABM tiers use the same four categories. What changes is which category gets the most weight. This is where most ABM measurement breaks. Teams pick KPIs that work for a 1:1 program and try to apply them to a 1:many program — or vice versa. The fix is explicit weighting per tier.
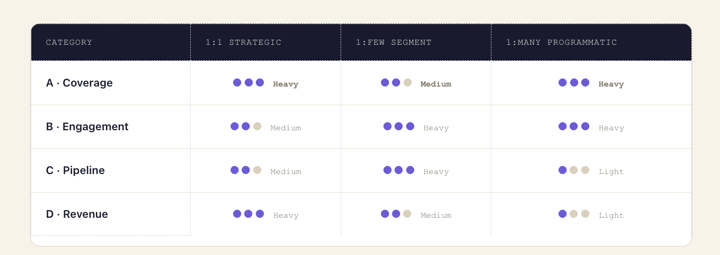
1:1 ABM
5–20 named accounts · custom microsites · executive orchestration
- →Buying committee coverage
- →Executive engagement depth
- →Stage progression per account
- →ACV lift vs. non-ABM
- →Account expansion
1:Few ABM
20–100 accounts by use-case · 90-day sprints
- →Account-to-opp by segment
- →Committee coverage (4–6 roles)
- →Pipeline velocity lift
- →Win rate lift by segment
- →Engagement score trend
1:Many ABM
100–600 accounts · programmatic · always-on
- →Target account reach
- →In-market account ID rate
- →Engagement score distribution
- →Cost per engaged account
- →Tier-up rate
What good looks like.
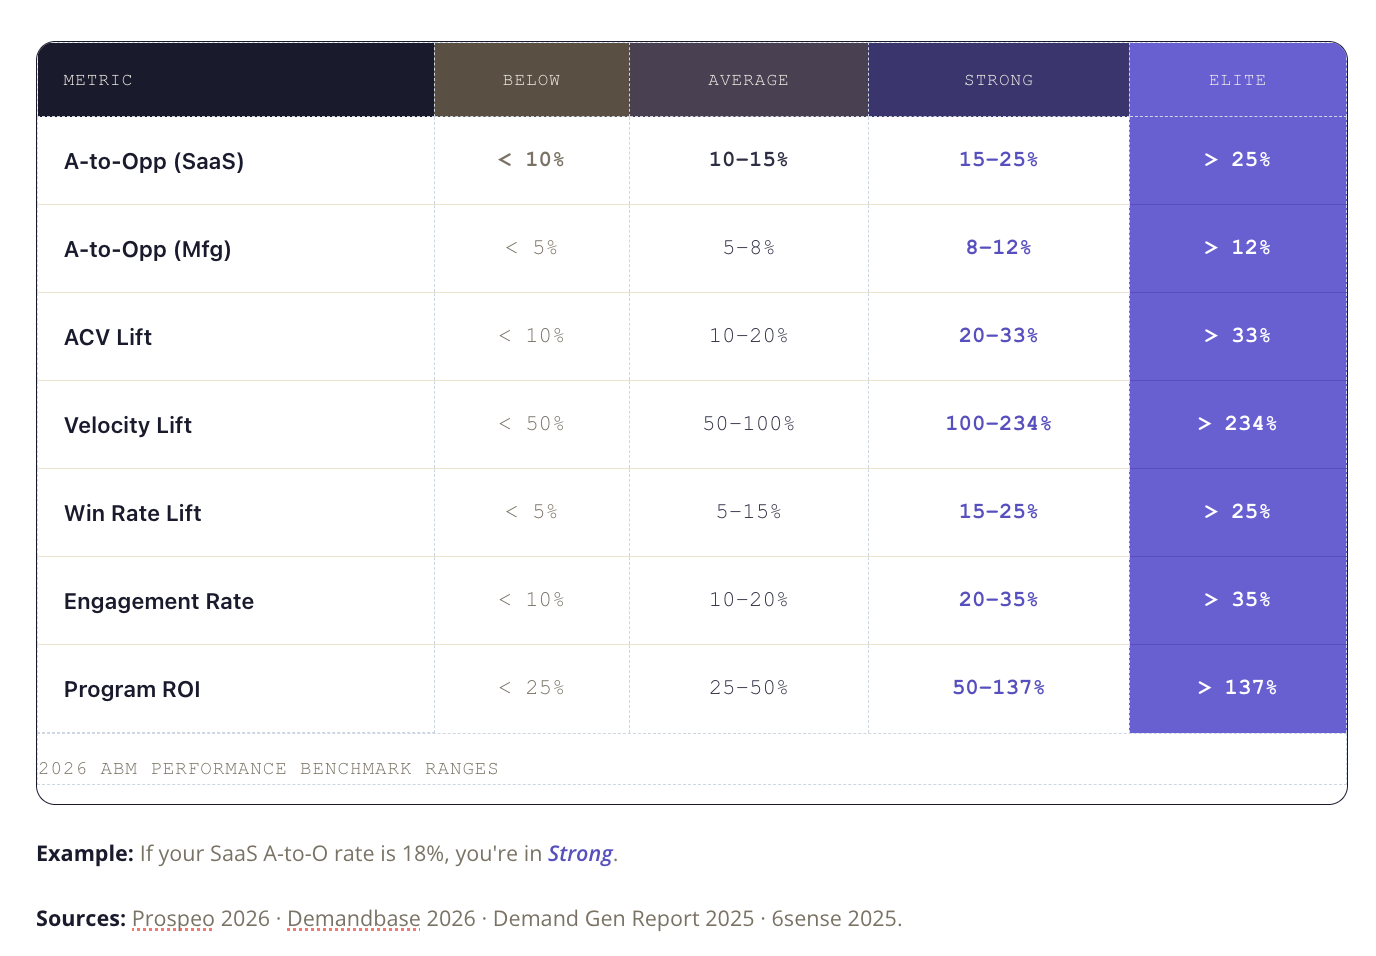
Find your metric in the left column, then read across to see which tier you're in. Industries diverge. SaaS converts ~2× the rate of manufacturing — use the matching row, not the headline figure.
Five ways measurement quietly fails.
The framework rarely fails. The mistakes around it do.
Measuring too early.
Mid-market ABM takes 3–6 months. Enterprise: 12–18+. Pulling the plug at month two kills more programs than any other mistake.
MQL fixation.
Half of ABM teams still report through MQLs. Random inbound and target-account MQAs end up in the same column. The strategic claim dies there.
Weak account selection.
Firmographics-only targeting picks accounts that aren't in-market. No intent, no technographics, no triggers. Penetration flatlines.
Activity over progression.
Clicks and opens describe the campaign. Stage progression describes the account. Report the second, not the first.
Dirty contact data.
Bounce > 5% means engagement scores are fiction. Every bounce is a touchpoint that never happened. Audit data before auditing strategy.
From framework to fully wired in 90 days.
This isn't a generic playbook — it's how we run engagements.
Each phase has clear deliverables and a fixed-scope handoff. By day 90, your team operates the framework independently.
Baseline first
Audit current ABM data. Measure A-to-opp rate, velocity, win rate from prior activity.
Baseline report + framework scorecard.
Tag the cohort
Mark HubSpot accounts as ABM or non-ABM. Wire Demandbase or 6sense intent feeds.
HubSpot properties live, sync verified.
Wire dashboards
One dashboard per category. Each at its own cadence. Tier-scoped throughout.
Four dashboards + QBR template.
First QBR
Run your first QBR. Tier-segmented, cohort-compared, action items by category.
Facilitated QBR + team handoff.
Sources.
Every claim traces to industry research published in 2025 or 2026.