Lead attribution is simple. Someone clicks an ad, fills out a form, the ad gets the credit. Done.
ABM doesn't work that way. By the time a target account signs, it has usually collected 15 to 50 touches across ads, content, events, and sales outreach. For enterprise deals with a full buying committee, that plays out over 6 to 18 months (Hey Sid, 2026).
So when a $60,000 deal closes, which activities get the credit, and how much each? That's the whole problem, and the answer changes completely depending on the model you pick. Below, we run one account through eight models so you can watch the credit move. If you'd rather not build this yourself, it's the kind of measurement we set up inside HubSpot ABM programs before a campaign launches.
Key takeaways:
- ABM attribution credits an account's whole buying group, not one converting lead.
- First-touch and last-touch models hide most of the journey. Use multi-touch.
- For long B2B cycles, W-shaped and full-path (Z-shaped) models fit best.
- HubSpot supports these natively on Marketing Hub Pro and Enterprise. Demandbase measures account progression instead.
- Don't trust one model. Run two or three side by side and read the gap.
Why ABM attribution is harder than lead attribution
It isn't a data problem. It's a fit problem. The old models were built to credit a single conversion, not the coordinated movement of a group. Two things make ABM different.
The unit is the account, not the contact. Good attribution asks which campaigns engaged several stakeholders and in what order the deal moved, not just "which channel produced this lead." If you've ever mapped a buying committee, you know one form rarely tells the real story.
The touches that matter most are often invisible. The CMO who reads your thought leadership but never fills out a form. The finance lead checking pricing anonymously. The team passing your PDF around a private Slack channel. More than 86% of B2B marketers say they struggle to connect multiple stakeholders to one opportunity (Hey Sid, 2026).
No surprise, then, that attribution tops the list of ABM headaches. In Gartner's research, 39% of B2B marketers called it their single biggest ABM challenge (via Hey Sid, 2026). Get it right and the payoff is real: well-integrated programs report MQA-to-pipeline conversion above 22%, versus a 14% baseline for teams running disconnected systems (Demandbase, 2026).
One account, eight models
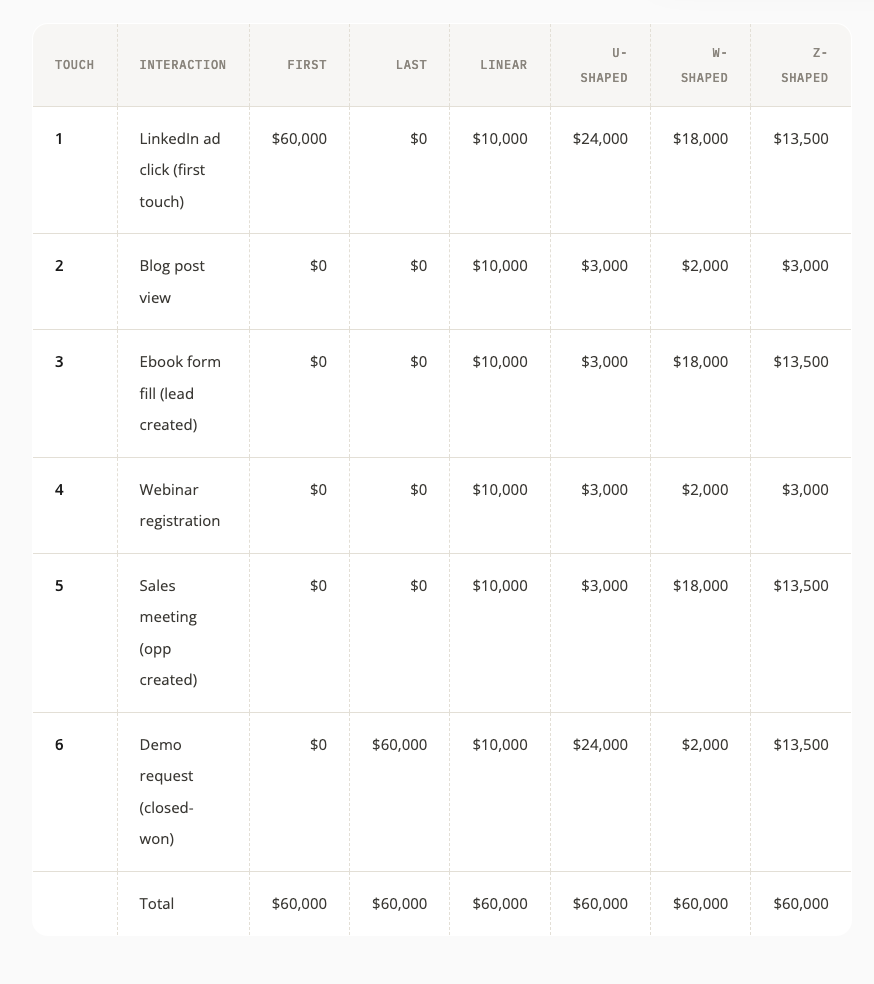
Here's the example we'll use throughout. A mid-market B2B SaaS buyer. A $60,000 deal. Six recorded touches over five months:
- LinkedIn ad click (first touch)
- Blog post view (organic, mid-funnel)
- Ebook form fill (lead created)
- Webinar registration
- Sales meeting booked (opportunity created)
- Demo request (last touch, closed-won)

The account journey we'll attribute. Four of the six touches mark a milestone the multi-touch models care about. Now watch the same $60,000 land in very different places.
Single-touch models
First-touch gives all the credit to the opening interaction. The LinkedIn ad takes the full $60,000; everything else gets zero. It tells you what created demand and nothing about what closed it.
Last-touch flips that. The demo request takes the whole $60,000. It flatters the bottom of the funnel and erases five months of nurture that made the demo possible.
Both are quick to read. Both lie to you about a six-month committee deal.
Multi-touch models
Linear splits the credit evenly: six touches, 16.7% each, $10,000 apiece. It's the fairest model and a fine starting point, but it treats a one-minute blog skim as the equal of a sales meeting.
U-shaped (position-based) weights the ends. First and last touch get 40% each; the middle shares the remaining 20%. So the LinkedIn ad and the demo take $24,000 each, and the four middle touches split $12,000.
W-shaped adds a third anchor. It gives about 30% each to three milestones (first touch, lead creation, opportunity creation) and scatters the last 10% across the rest. It's the model most people recommend for considered B2B purchases. One warning: definitions drift, and some vendors swap "opportunity creation" for "conversion," so check which version your platform uses (Triple Whale).
Z-shaped (full-path) stretches W-shaped to four peaks: first touch, lead creation, opportunity creation, and the close, at 22.5% each, with 10% for the rest. It's built for the long, multi-stage cycles ABM teams live in.
Here's the same $60,000 under the four cleaner multi-touch models:
 Each model's name describes its shape. U-shaped peaks at the ends, W-shaped adds a middle peak for lead creation, Z-shaped adds a fourth for the close.
The total never moves. What moves is who looks like the hero.
Last-touch crowns the demo and ignores everything that set it up. W-shaped makes your gated ebook and the SDR's first meeting look essential. Pick the wrong model and you'll quietly defund the channels that are actually sourcing your pipeline.
Two models without fixed percentages
Time-decay gives steadily more credit to touches near the close. In our journey the LinkedIn ad might keep around 5% while the sales meeting and demo swallow more than half. Fine for short buying windows. In a six-month enterprise cycle it badly underrates the early content that built the case, so handle it with care (Growth Jockey, 2025).
Data-driven (algorithmic) throws out fixed weights and uses machine learning on your own pipeline history to assign credit by measured influence. It's the most accurate approach in theory. It also needs real conversion volume to stay stable, so smaller programs tend to get a model that lurches month to month (Dreamdata).
ABM attribution in HubSpot
If you run ABM on HubSpot, attribution lives under Reporting > Reports > Create report > Attribution. It requires Marketing Hub Professional or Enterprise (Cometly, 2026). There are three report types:
- Contact Create — what fills the funnel
- Deal Create — what generates new deals (Enterprise only)
- Revenue — what ties to closed money
HubSpot ships First Touch, Last Touch, Linear, U-shaped, Time Decay, W-shaped, and full-path out of the box, and it can plot more than one model on the same chart so you can compare them (HubSpot). It credits ad clicks, form submissions, email clicks, page views, event registrations, and logged calls.
One practical move: build a W-shaped revenue report for the quarter, then clone it as last-touch. Any channel that looks dominant in last-touch but ordinary in W-shaped is closing deals other channels sourced.

An illustrative comparison, not a product screenshot. The gap between the two models is the insight: the demo closes deals that LinkedIn and content sourced months earlier.
The thing that wrecks all of this, every time, is sloppy UTM tagging. Get tiered account scoring and ABM dashboards configured properly, with lifecycle stages defined the same way across the team, and the reports start telling the truth.
ABM attribution in Demandbase
Platforms built for ABM lean less on touch percentages and more on account progression. Demandbase's Journey Stage analytics tracks how accounts move between stages and measures conversion rate and velocity at each step, alongside reports for pipeline by stage, win rate by tier, and account-based return on ad spend (Demandbase, 2026). The shift is from "which touch converted this lead" to "what moved this account, and how fast."
The benchmark data backs the account view. Across 1,452 Demandbase instances, accounts backed by sustained buying-group advertising converted to opportunities at two to three times the rate of accounts with none (Demandbase, 2026). If you already own Demandbase or 6sense, the gap is usually configuration, not tooling, which is the core of a Demandbase implementation.
The numbers worth quoting to your CFO
Attribution exists to defend a budget, so keep these handy:
- 2.6x more pipeline per marketing dollar than broad demand generation
- 41% higher win rates and 33% larger average deal sizes once an account converts
- ~145% average ABM ROI in 2026 (a 2.45x return); top programs report 7.5x to 9x
- 87% of B2B marketers say ABM beats their other approaches on ROI
(Figures compiled from ABM Leadership Alliance, ITSMA, and Gartner data, 2026.) None of it holds up in a budget meeting without a model finance can follow. Our ABM KPI framework is a free starting point.
How to choose a model
There's no universal winner. The right model matches how your accounts actually buy. A rough guide:
- Long, multi-stakeholder cycles: W-shaped or full-path. They credit the lead-creation and opportunity-creation moments that drive committee buying.
- High volume, capable platform: data-driven, validated against a positional model.
- Avoid relying on first-touch, last-touch, or time-decay alone. Each hides part of the journey.
Three mistakes show up again and again: a 30-day window on a six-month cycle (it deletes the early touches), measuring contacts when a group makes the decision, and trusting a single model instead of reading the gap between two or three.
Frequently asked questions
What attribution model should a B2B ABM team use?
For long sales cycles, W-shaped or full-path (Z-shaped) fits best, because both credit the lead-creation and opportunity-creation milestones that matter in committee buying. Teams with high conversion volume can move to data-driven. Whatever you choose, compare it against last-touch so you can see which channels source pipeline versus close it.
How do you set up a measurable framework for ABM pipeline and revenue?
Start before launch, not after. Define account tiers, agree on lifecycle and opportunity stages so everyone scores deals the same way, pick a primary model with a window that matches your real cycle, and build dashboards for influenced pipeline, win rate by tier, and velocity. We build this as part of our HubSpot ABM setup, and the ABM KPI framework covers the metrics that belong in it.
Can you do ABM attribution natively in HubSpot?
Yes, on Marketing Hub Professional or Enterprise. HubSpot offers First Touch, Last Touch, Linear, U-shaped, Time Decay, W-shaped, and full-path models, three report types (Contact Create, Deal Create, Revenue), and the option to compare models on one chart. Deal Create requires Enterprise.
How do you attribute a deal across a multi-stakeholder buying committee?
Attribute at the account level, not per contact. Map the committee first so you know whose touches to roll up, then use a multi-touch model that credits the key milestones across the group. A shared buying committee template keeps this consistent.
What's the difference between W-shaped and full-path attribution?
W-shaped credits three milestones (first touch, lead creation, opportunity creation) at about 30% each, with 10% spread elsewhere. Full-path (Z-shaped) adds a fourth peak for the close and gives 22.5% to each of the four. Full-path suits longer cycles where the close deserves explicit credit.
What attribution window should you use for ABM?
Match it to your real cycle. A 30-day window on a six-month deal throws away the early touches that built the case. For most enterprise ABM, six months or longer is more honest.
Next Steps: Set the framework up once and stop arguing about it
Most attribution debates are really tooling debates in disguise: the window is wrong, the stages aren't defined the same way, the UTMs are a mess. Fix the setup and the reports start telling the truth.
Want a second set of eyes on how your account-level attribution is built? Take the ABM readiness assessment or book a 30-minute call.
Sources
- Demandbase, State of ABM 2026: Pipeline Benchmarks (Mar 2026)
- Demandbase, Measure ABM Like a Boss (Jan 2026)
- Hey Sid, Account-Based Marketing Attribution Guide (Feb 2026)
- abmatic, ABM Attribution Models: A Guide for 2026 (Oct 2025 / May 2026)
- HubSpot Knowledge Base, Create attribution reports and Understand attribution reporting (2025–26)
- Cometly, Marketing Attribution in HubSpot and HubSpot Attribution Tracking (2026)
- Hockeystack, B2B Multi-Touch Attribution (Dec 2025)
- Triple Whale, Multi-Touch Attribution (MTA); Dreamdata, Multi-Touch Attribution
- Growth Jockey, Multi-Touch Attribution Models: Guide for 2025 (Aug 2025)
- Geisheker, Most Effective ABM Platforms for B2B Enterprise Pipeline (2026), compiling ABM Leadership Alliance, ITSMA Momentum, and Gartner (Nov 2025 Magic Quadrant) data